

Let's Build a Website Uptime Bot with Google Apps Script
Published on 7/9/2018 by Justin Williamson
If you are just here for the code, go here
Here's the thing - I know I should be monitoring all of my websites' uptime...but I'm real lazy. So, let's automate this. I mean, this shouldn't require a lot of effort, right?
I present to you today a solution for monitoring the uptime of ALL of your sites in a very custom manner that won't cost you a penny and doesn't require a server to run it. What is this magic, you ask?
It's Google Apps Script . More specifically, Google Sheets scripting - a very powerful set of tools that is limited only by your imagination.
I've seen a few other scripts out there that do the same thing as this, but I haven't found one that behaves quite how I want it to, so let's hurry up and build this thing before Google gets smart and charges us for it.
Building the Script
The sheet is going to be pretty simple - enter your website URLs and a corresponding notification email (to be notified when the site is down) and set up your timed trigger.
Something like this:

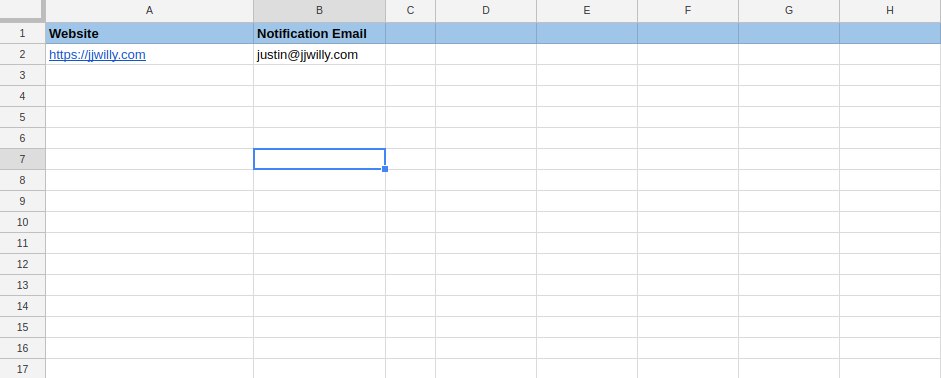
Let's name this sheet Websites.
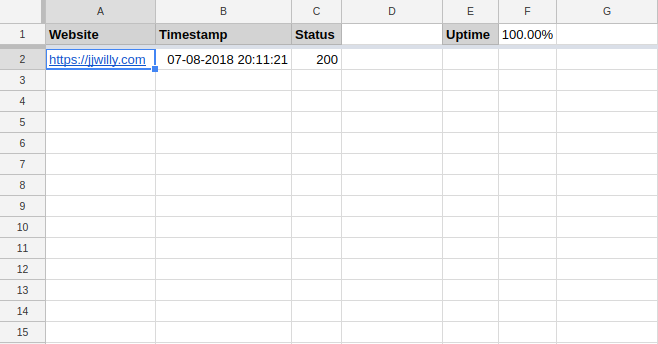
I'll also want to keep a log of all of the requests, so the script will create a new sheet tab for each website entered into sheet 1.
Something like this:

Now, to create a script that is attached to our sheet, we'll click Tools => Script Editor and a new tab will open up. Let's rename the file checkWebsiteStatus.gs.
Let's start by setting a few variables and creating the function.
// The timezone your logs will be using
var TIMEZONE = 'CST';
// The date format for the logs
var DATE_FORMAT = 'MM-dd-yyyy HH:mm:ss';
// The max amount of rows you want to keep in each log
var MAX_ROWS = 10000;

function checkWebsiteStatus() { }
Next, we need to set a few more variables to get the list of websites we need to ping.
function checkWebsiteStatus() {

  // Get the spreadsheet
  var ss = SpreadsheetApp.getActiveSpreadsheet();

  // Our website list sheet
  var sheet = ss.getSheetByName("Websites");

  // Get the last row
  var lrow = sheet.getLastRow();

  // Select the range that contains the site data.
  var sheetData = sheet.getRange(2, 1, lrow - 1, 2);

  // Format the site data into an array of objects
  var siteData = sheetData.getValues().map(function (member) {
    return {
      url: member[0],
      email: member[1],
    };
  });

  // Set our logging breakdown header that displays the total uptime
  var sheetBreakdownHeaders = [['Uptime']];

  // Set our logging page headers
  var sheetHeaders = [['Website', 'Timestamp', 'Status']];
}
Now the siteData variable contains a nice array of objects that will be easy to loop through and ping our sites. It will look like this:
[
  {
    url: 'https://jjwilly.com',
    email: 'justin@jjwilly.com'
  }
]
Let's write the function that will create a new logging sheet for each site entry (if it needs to).
function createSheet(site) {

  // Assign a sheet name
  site.sheetName = site.url.split('//').pop();

  // Only create this sheet if it doesn't exist yet
  if (!ss.getSheetByName(site.sheetName)) {

    ss.insertSheet(site.sheetName);
    var currentSheet = ss.getSheetByName(site.sheetName);

    // Set the breakdown headers, format them and set the values
    currentSheet
      .getRange(1, sheetHeaders[0].length + 2, sheetBreakdownHeaders.length, 1)
      .setFontWeight('bold')
      .setBackground('lightgray')
      .setValues(sheetBreakdownHeaders);

    // Do the same for the regular headers
    currentSheet
      .getRange(1, 1, 1, sheetHeaders[0].length)
      .setFontWeight('bold')
      .setBackground('lightgray')
      .setValues(sheetHeaders);

    // Freeze the headers for easier readability
    currentSheet.setFrozenRows(sheetBreakdownHeaders.length);
  }
  return site;
}
Next we need a function to ping the sites.
function checkIfSitesAreUp() {

  // loop through all site data
  for (var i = 0; i < siteData.length; i++) {

    // here's where we will create our log sheet
    var currentSite = createSheet(siteData[i]);

    // attempt to ping the site
    try {
      currentSite.response = UrlFetchApp.fetch(currentSite.url);
      currentSite.responseCode = currentSite.response.getResponseCode();
      if (currentSite.responseCode && currentSite.responseCode != 200) {
        websiteDown(currentSite, 'Response Code: ' + currentSite.responseCode);
      }
    } catch (err) {
      currentSite.error = err;
      currentSite.responseCode = -1;
      websiteDown(currentSite, currentSite.error);
    }

    insertLogEntry(currentSite, currentSite.responseCode || currentSite.error);

  }

  cleanUp();
}
You may have noticed a few new function calls in there. Here's our websiteDown function that will be called in case of a failed ping attempt:
// Sends an email with error details
function websiteDown(siteData, error) {
  MailApp.sendEmail(siteData.email, 'One of your websites is down.', siteData.url + ' is currently down. \n\nHere is the error: \n\n' + error);
}
And here's our logging function:
function insertLogEntry(site, status) {
  var timestamp =  Utilities.formatDate(new Date(), TIMEZONE, DATE_FORMAT);
  var currentSheet = ss.getSheetByName(site.sheetName);
  currentSheet
    .getRange(currentSheet.getLastRow() + 1, 1, 1, 3)
    .setValues([[site.url, timestamp, status]]);
}
Now let's create a function that will clean up the sheets a bit.
function cleanUp() {

  // Loop through each sheet
  ss.getSheets().forEach(function (sheet) {

    // Don't need to modify the 'Websites' sheet
    if (sheet.getName() != 'Websites') {

      // Rotate logs
      rotateLogs(sheet);

      // Get total uptime percentage
      printTotalUptimePercentage(sheet);
    }

    // Auto-resize all columns in all sheets
    sheet.autoResizeColumns(1, sheet.getLastColumn());

  });
}
Of course, the logs will need to be rotated. This is not 100% necessary, but I don't want these logs getting out of control.
function rotateLogs(sheet) {
  var startAt = sheetBreakdownHeaders.length;
  var numRows = sheet.getLastRow() - startAt;
  if (numRows > MAX_ROWS) {
    sheet.deleteRows(startAt + 1, numRows - MAX_ROWS);
  }
}
Lastly, we need to print the total uptime percentage on each log sheet. We could just create a formula to calculate this for us, but I prefer to do it this way:
function printTotalUptimePercentage(sheet) {

  // Identifies the row where the data begins
  var startAt = sheetBreakdownHeaders.length;

  // Count the number of rows that have data
  var numRows = sheet.getLastRow() - startAt;

  // Get all of the status codes in an array
  var allData = sheet
    .getRange(startAt + 1, sheetHeaders[0].indexOf('Status') + 1, Math.min(numRows, MAX_ROWS), 1)
    .setNumberFormat('0')
    .getValues()
    .map(function (member) { return member[0]; });

  // Calculate the total uptime percentage
  var totalUptime = ((allData.filter(function (member) { return member == 200; }).length / allData.length) * 100).toFixed(2) + '%';

  // Insert the results onto each sheet
  sheet.getRange(1, sheetHeaders[0].length + 3, 1, 1).setValue(totalUptime);
}
The Final Code:
/**
 * Change these variables to your liking
 */
var TIMEZONE = 'CST';
var DATE_FORMAT = 'MM-dd-yyyy HH:mm:ss';
var MAX_ROWS = 10000;

function checkWebsiteStatus() {

  var ss = SpreadsheetApp.getActiveSpreadsheet();
  var sheet = ss.getSheetByName("Websites");
  var lrow = sheet.getLastRow();
  var sheetData = sheet.getRange(2, 1, lrow - 1, 2);
  var siteData = sheetData.getValues().map(function (member) {
    return {
      url: member[0],
      email: member[1],
    };
  });
  var sheetBreakdownHeaders = [['Uptime']];
  var sheetHeaders = [['Website', 'Timestamp', 'Status']];

  checkIfSitesAreUp();

  function createSheet(site) {
    site.sheetName = site.url.split('//').pop();
    if (!ss.getSheetByName(site.sheetName)) {
      ss.insertSheet(site.sheetName);
      var currentSheet = ss.getSheetByName(site.sheetName);
      currentSheet
        .getRange(1, sheetHeaders[0].length + 2, sheetBreakdownHeaders.length, 1)
        .setFontWeight('bold')
        .setBackground('lightgray')
        .setValues(sheetBreakdownHeaders);

      currentSheet
        .getRange(1, 1, 1, sheetHeaders[0].length)
        .setFontWeight('bold')
        .setBackground('lightgray')
        .setValues(sheetHeaders);

      currentSheet.setFrozenRows(sheetBreakdownHeaders.length);
    }
    return site;
  }

  function checkIfSitesAreUp() {
    for (var i = 0; i < siteData.length; i++) {

      var currentSite = createSheet(siteData[i]);

      try {
        currentSite.response = UrlFetchApp.fetch(currentSite.url);
        currentSite.responseCode = currentSite.response.getResponseCode();
        if (currentSite.responseCode && currentSite.responseCode != 200) {
          websiteDown(currentSite, 'Response Code: ' + currentSite.responseCode);
        }
      } catch (err) {
        currentSite.error = err;
        currentSite.responseCode = -1;
        websiteDown(currentSite, currentSite.error);
      }

      insertLogEntry(currentSite, currentSite.responseCode || currentSite.error);

    }

    cleanUp();
  }

  function websiteDown(siteData, error) {
    MailApp.sendEmail(siteData.email, 'One of your websites is down.', siteData.url + ' is currently down. \n\nHere is the error: \n\n' + error);
  }

  function insertLogEntry(site, status) {
    var timestamp =  Utilities.formatDate(new Date(), TIMEZONE, DATE_FORMAT);
    var currentSheet = ss.getSheetByName(site.sheetName);
    currentSheet
      .getRange(currentSheet.getLastRow() + 1, 1, 1, 3)
      .setValues([[site.url, timestamp, status]]);
  }

  function cleanUp() {
    ss.getSheets().forEach(function (sheet) {

      if (sheet.getName() != 'Websites') {

        // Rotate logs
        rotateLogs(sheet);

        // Get total uptime percentage
        printTotalUptimePercentage(sheet);
      }

      // Auto-resize all columns in all sheets
      sheet.autoResizeColumns(1, sheet.getLastColumn());

    });
  }

  function rotateLogs(sheet) {
    var startAt = sheetBreakdownHeaders.length;
    var numRows = sheet.getLastRow() - startAt;
    if (numRows > MAX_ROWS) {
      sheet.deleteRows(startAt + 1, numRows - MAX_ROWS);
    }
  }

  function printTotalUptimePercentage(sheet) {
    var startAt = sheetBreakdownHeaders.length;
    var numRows = sheet.getLastRow() - startAt;
    var allData = sheet
      .getRange(startAt + 1, sheetHeaders[0].indexOf('Status') + 1, Math.min(numRows, MAX_ROWS), 1)
      .setNumberFormat('0')
      .getValues()
      .map(function (member) { return member[0]; });
    var totalUptime = ((allData.filter(function (member) { return member == 200; }).length / allData.length) * 100).toFixed(2) + '%';
    sheet.getRange(1, sheetHeaders[0].length + 3, 1, 1).setValue(totalUptime);
  }

}
It's not perfect, but I'm not going to complain. It's free.